Work with a dedicated Real Estate Advisor who will take your financial preferences and help you select and acquire properties that fit your criteria. Learn more

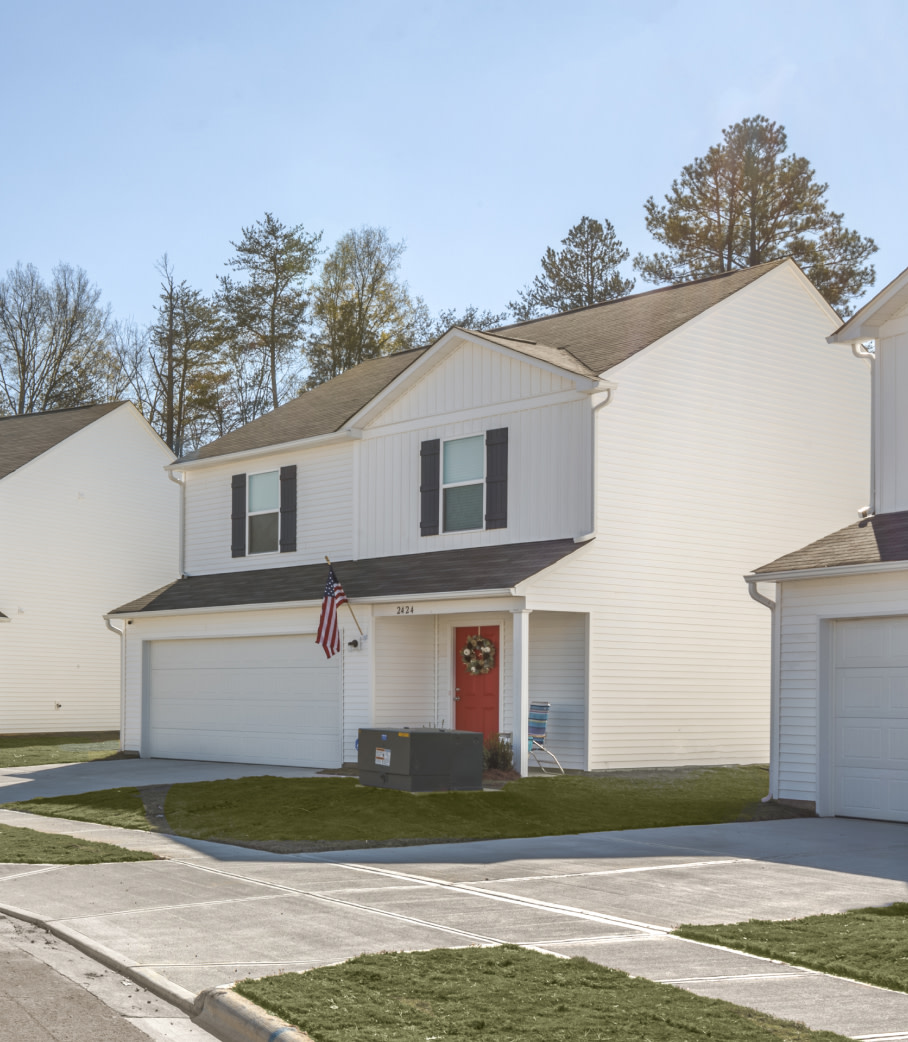
2005 Zavala Forney, TX 75126

3 Beds 2 Baths 1,556 sqft Built 2014

INVESTimate

$220,000

List Price

$1,590

$1,431 - $1,749

Rent Est.

$229,548  ( +4.34%)   1 YR EST. FORECAST

PROPERTY INFO

August 25, 2020 RECENTLY ADDED
FACTS
  • Built In 2014
  • Price/Sqft : $141.39
  • 2 Days on Market
  • MLS # : 14420231
  • Updated Date : 08/25/2020 at 02:00
CONSTRUCTION
  • Beds : 3
  • Floor Size : 1,556 sqft
  • Baths : 2 full
Listing Agent

Competitive Edge Realty Llc

Listing Agent's Description

Beautiful!!! Well maintained 3 bedroom 2 bathroom home with an open concept floor plan. This home is great for entertaining, with adjoining kitchen and family room. Conveniently located minutes away from Rockwall and near highway 80 for travels into Dallas. This is a home you don't want to miss!!

SEE MORE

MARKET HIGHLIGHTS

  • . Dallas has 7th largest concentration of high-tech jobs in the U.S. (Dallas Chamber)
  • # 1 in the country for job growth in 2017 (2.6% growth, 91,700 new jobs) (US Census, Forbes, 2017)
  • Dallas metro's economy is worth $579 billion in Gross Metro Product and projected to grow to $613 billion in 2019 (USMayors.org, 2018)
  • Home to 20 Fortune 500 headquarters, 39 Fortune 1000 headquarters and 12 of Forbes' top private companies (Fortune)
  • Dallas metro contributes to 31.9%% of Texas state economy i.e. Gross State Product (USMayors.org, 2018)
  • Dallas metro has 67.1% labor force participation rate higher than the national rate 62.8% (USMayors.org, 2018)

PRICE & RENT TRENDS

Neighborhood: Travis Ranch

NeighborhoodNIR Market*CityMarket2010Year20002019130k140k150k160k170k180k190k200k210k220k230k240k250kPrice in $122k250k

* NIR Market: Aggregated price or rent trend of all neighborhoods with same NIR

Neighborhood: Travis Ranch

NeighborhoodNIR Market*CityMarket2010Year20002019 Q2120013001400150016001700180019002000Rent in $11262024

* NIR Market: Aggregated price or rent trend of all neighborhoods with same NIR

SCHOOLS

NAME EDUCATIONAL LEVEL SCHOOL TYPE # OF STUDENTS # OF TEACHERS GREATSCHOOLS RATING
Lewis Elementary School Primary Regular 472 27 7
Brown Middle School Middle Regular 718 41 7
North Forney High School High Regular 1,274 83 7

Lewis Elementary School

  • Education Level: Primary
  • # of students: 472
  • # of teachers: 27
7
GreatSchools Rating

Brown Middle School

  • Education Level: Middle
  • # of students: 718
  • # of teachers: 41
7
GreatSchools Rating

North Forney High School

  • Education Level: High
  • # of students: 1,274
  • # of teachers: 83
7
GreatSchools Rating
 

$198,000$242,000$220,000

PURCHASE PRICE

$1,431$1,749$1,590

RENT

DOWN PAYMENT
FINANCING

PROJECTED ACCUMULATED WEALTH

30 YEAR PROJECTION

  • Cash Flow
  • Appreciation
  • Principal
11530$0.0$100k$200k$300k$400k$500k$600k

PROJECTED ANNUAL CASH FLOW

11530-$4.0k-$2.0k$0.0$2.0k$4.0k$6.0k$8.0k

PROJECTED PROPERTY VALUE

30 YEAR PROJECTION

  • Appreciation
  • Principal
  • Loan Balance
11530$0.0$100k$200k$300k$400k$500k$600k

FINANCIALS

PROJECTED BASIC MONTHLY INCOME STATEMENT

INCOME Rent $1,590
EXPENSES Loan Payment -$812
Property Tax -$561
Property Insurance -$117
HOA -$30
Property Management Fees -$99
CASH FLOW
-$29

This is the estimated cash flow generated during a typical maintenance-free month. It is recommended that investors set aside 14% of earned rent to cover both maintenance and periods of vacancy.

$220,000

PROJECTED PRICE

$1,590

PROJECTED RENT

0.72%

PROJECTED RENT / PRICE RATIO

ASSUMPTIONS

Expense Inflation 2.50%
Rental Growth Year (1-5) 3.78%
Appreciation Year (1-5) 4.34%
Maintenance Year (1-5) 8.00%
Vacancy 6.39%
Length of Stay Years 2

TOTAL CASH OUT OF POCKET

TOTAL OUT OFPOCKET$64,050

INVESTMENT

$64,050

Down Payment
$55,000
Rehab Estimate
$5,750
Closing Costs
$3,300

LOAN DETAILS

25%

DOWN PAYMENT

HOMEUNION RECOMMENDS:

A 60% down payment or higher enables the proceeds from the asset to cover all costs.

$812

MONTHLY LOAN PAYMENT

30 yr
Term
4.25%
Interest
25.00%
Down Payment
Term 30 Years
Interest 4.25%
Down Payment $55,000
Loan Amount $165,000
See What Happens When You Reinvest Cash Flow

3.58

YEARS SAVED

$8,598

INTEREST SAVED

CASH FLOW REINVESTMENT

The time & interest saved by applying each month's positive cash flow towards loan principal pay down.

  • $1,590

    LIST RENT
  • $1.02

    LIST RENT PER SQFT
  • $1,583

    COMP ESTIMATED VALUE
  • $1.02

    COMP AVG. RENT PER SQFT
Comps Range
$1,590
1$1,5902$1,5953$1,6404$1,6955$1,695
$1,695
RENT COMPS ANALYSIS
  • 2005 Zavala Forney, TX 1
    • 3 beds 2 baths ∙ 1,556 Sqft ∙ Built 2014 3 beds 2 baths ∙ 1,556 Sqft ∙ Built 2014
    property image
    • Rent
    • Rent Per SQFT
    •  
    • $1,590
    • $1.02
    •  
  • 1031 Johnson City Avenue Forney, TX 2
    • 3 beds 2 baths ∙ 1,609 Sqft ∙ Built 2007 3 beds 2 baths ∙ 1,609 Sqft ∙ Built 2007
    property image
    LEASED 02/22/20
    • Rent
    • Rent Per SQFT
    •  
    • $1,595
    • $0.99
    •  
  • 1004 Shackelford Lane Forney, TX 3
    • 3 beds 2 baths ∙ 1,578 Sqft ∙ Built 2005 3 beds 2 baths ∙ 1,578 Sqft ∙ Built 2005
    property image
    LEASED 08/02/20
    • Rent
    • Rent Per SQFT
    •  
    • $1,640
    • $1.04
    •  
  • 1002 Camp Verde Drive Forney, TX 4
    • 3 beds 2 baths ∙ 1,750 Sqft ∙ Built 2006 3 beds 2 baths ∙ 1,750 Sqft ∙ Built 2006
    property image
    LEASED 06/16/20
    • Rent
    • Rent Per SQFT
    •  
    • $1,695
    • $0.97
    •  
  • 2116 Hartley Drive Forney, TX 5
    • 3 beds 2 baths ∙ 1,582 Sqft ∙ Built 2007 3 beds 2 baths ∙ 1,582 Sqft ∙ Built 2007
    property image
    LEASED 08/19/20
    • Rent
    • Rent Per SQFT
    •  
    • $1,695
    • $1.07
    •  
PROPERTY LISTING DETAILS
Johnnell Worthen
Competitive Edge Realty Llc
Wade Shoop
1.866.250.5610
RentVest Property Management LLC
LIC TREC #9005027
North Texas Real Estate Information Services ( NTREIS)
MLS #: 14420231
Last Updated: 08/25/2020
BESbswy