Work with a dedicated Real Estate Advisor who will take your financial preferences and help you select and acquire properties that fit your criteria. Learn more
REQUEST INFO
It's free, with no obligation
PROPERTY INFO
FACTS
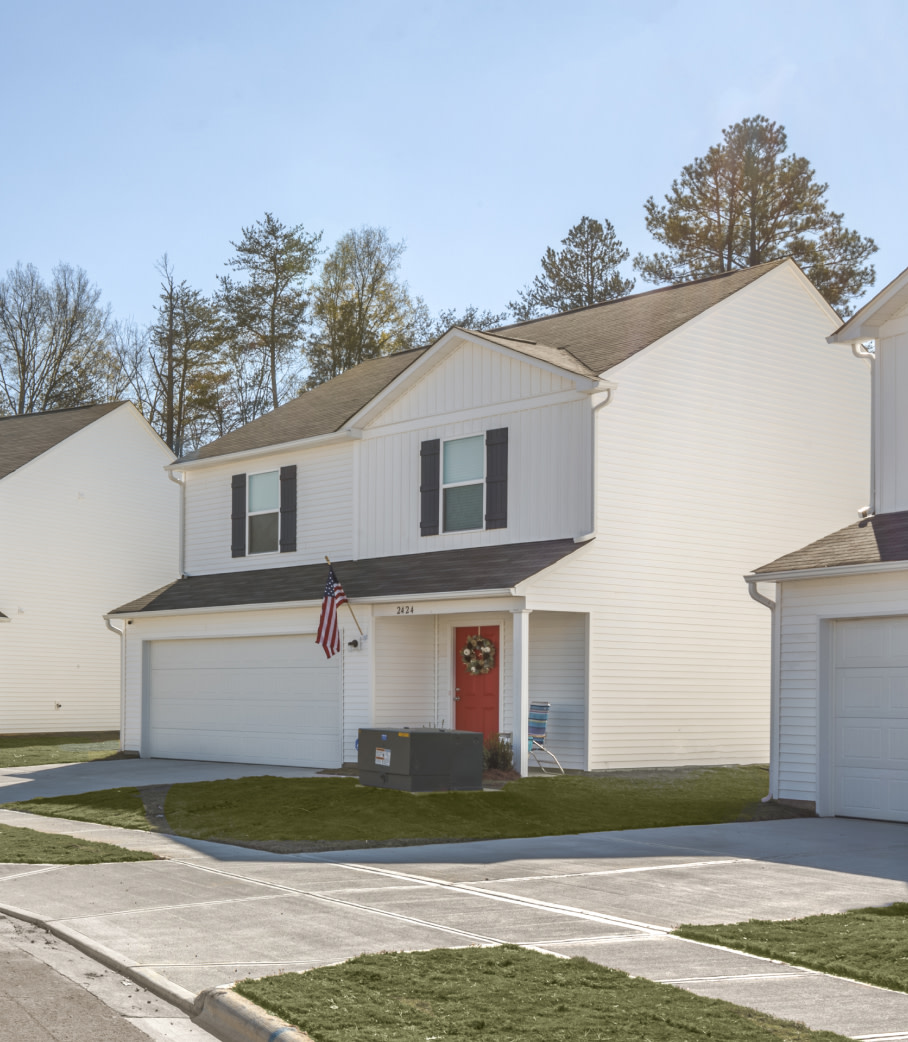
- Single Family
- Built In 2020
- Price/Sqft : $184.51
- 2 Days on Market
- MLS # : 14477883
- Updated Date : 11/28/2020 at 20:00
CONSTRUCTION
- Beds : 3
- Floor Size : 2,330 sqft
- Baths : 2 full , 2 half
Listing Agent
Ultima Real Estate
Listing Agent's Description
A visual testament to what a vision when impeccable design is actualized by superior artistry. The second floor has the Master bed and the Gameroom has a balcony offering a sense of serenity along with two other balconies, the balcony on the third floor offers partial views of Downtown ready for sunset and a glass of wine. Incredible light filled spaces highlight the sleek design and exquisite finishes A perfect blend of warmth and minimalist modern elegance. An entertainer’s dream kitchen featuring quartz countertops and custom cabinetry, The master bath is the ultimate spa like luxury. Coming home just got a different meaning now. THIS UNIT AND 2605 CROSSMAN IT'S AVAILABLE
SEE MORE
- Dallas metro contributes to 31.9%% of Texas state economy i.e. Gross State Product (USMayors.org, 2018)
- Dallas metro has 67.1% labor force participation rate higher than the national rate 62.8% (USMayors.org, 2018)
- . Dallas has 7th largest concentration of high-tech jobs in the U.S. (Dallas Chamber)
- # 1 in the country for job growth in 2017 (2.6% growth, 91,700 new jobs) (US Census, Forbes, 2017)
- Dallas metro's economy is worth $579 billion in Gross Metro Product and projected to grow to $613 billion in 2019 (USMayors.org, 2018)
- Home to 20 Fortune 500 headquarters, 39 Fortune 1000 headquarters and 12 of Forbes' top private companies (Fortune)
PRICE & RENT TRENDS
Neighborhood: Muncie
* NIR Market: Aggregated price or rent trend of all neighborhoods with same NIR
Neighborhood: Muncie
* NIR Market: Aggregated price or rent trend of all neighborhoods with same NIR
SCHOOLS
FINANCIALS
PROJECTED BASIC MONTHLY INCOME STATEMENT
INCOME | Rent | $3,420 |
EXPENSES | Loan Payment | -$1,586 |
Property Tax | -$1,019 | |
Property Insurance | -$162 | |
Property Management Fees | -$99 | |
CASH FLOW
$554
|
This is the estimated cash flow generated during a typical maintenance-free month. It is recommended that investors set aside 10% of earned rent to cover both maintenance and periods of vacancy.
$429,900
PROJECTED PRICE
$3,420
PROJECTED RENT
0.80%
PROJECTED RENT / PRICE RATIO
Expense Inflation | 2.50% |
Rental Growth Year (1-5) | 3.74% |
Appreciation Year (1-5) | 12.3% |
Maintenance Year (1-5) | 3.00% |
Vacancy | 6.69% |
Length of Stay Years | 2 |
PROJECTED ACCUMULATED WEALTH
30 YEAR PROJECTION
- Cash Flow
- Appreciation
- Principal
PROJECTED ANNUAL CASH FLOW
PROJECTED PROPERTY VALUE
30 YEAR PROJECTION
- Appreciation
- Principal
- Loan Balance
TOTAL CASH OUT OF POCKET
INVESTMENT
$115,924
LOAN DETAILS
$1,586
MONTHLY LOAN PAYMENT
Term | 30 Years |
Interest | 4.25% |
Down Payment | $107,475 |
Loan Amount | $322,425 |
11.42
YEARS SAVED
$90,359
INTEREST SAVED
CASH FLOW REINVESTMENT
The time & interest saved by applying each month's positive cash flow towards loan principal pay down.
-
$3,420
LIST RENT -
$1.47
LIST RENT PER SQFT
-
$3,425
COMP ESTIMATED VALUE -
$1.47
COMP AVG. RENT PER SQFT
Comps Range
PROPERTY LISTING DETAILS
Ultima Real Estate
1.866.250.5610
RentVest Property Management LLC
LIC TREC #9005027
MLS #: 14477883
Last Updated: 11/28/2020