Purchase an investment property with Mynd
Build a single-family rental portfolio that outperforms
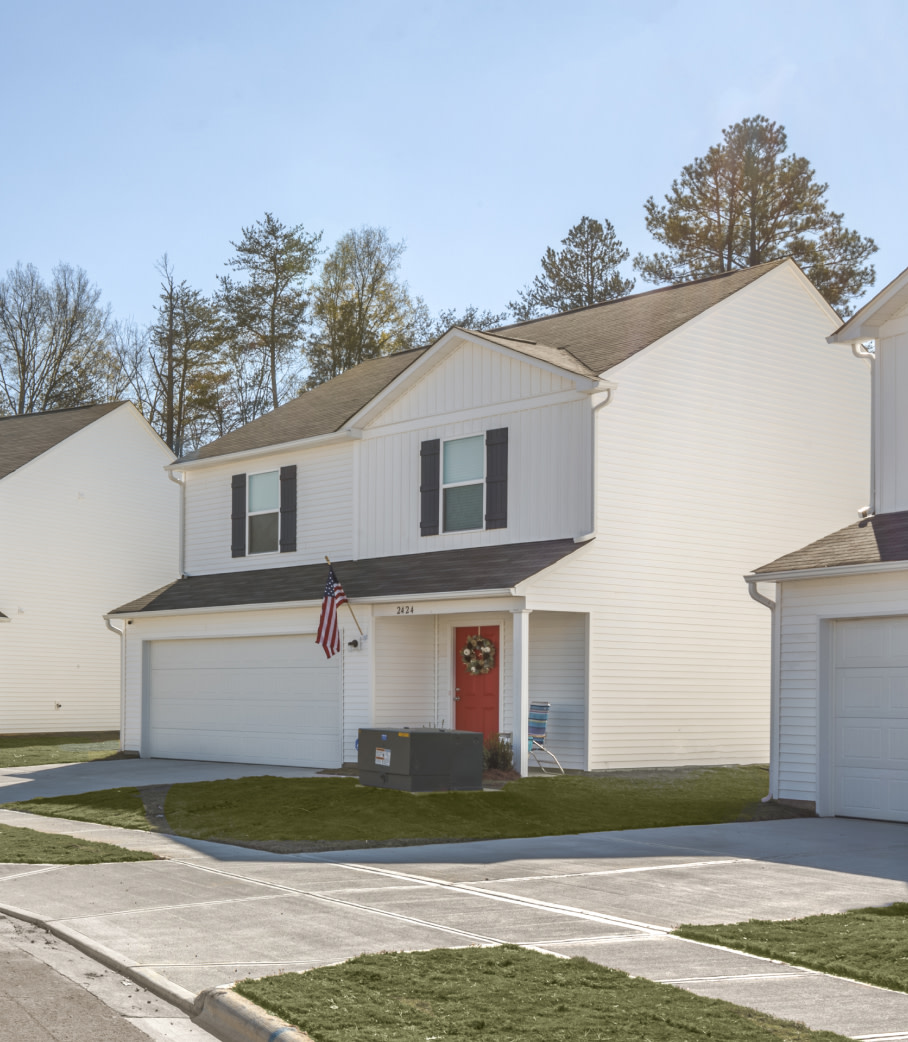
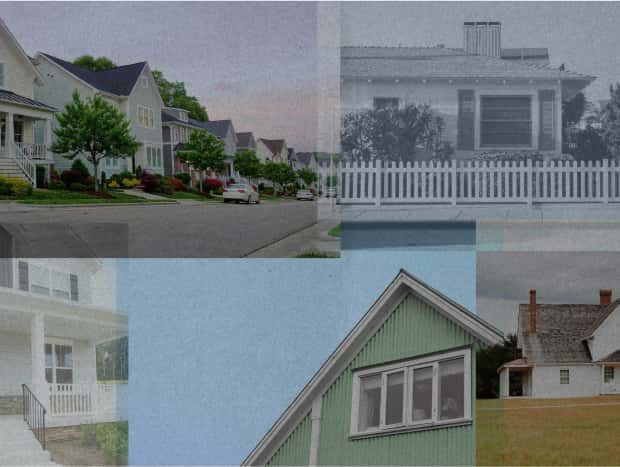
Curated investment properties
We help investors buy, lease, manage, and sell properties all-in-one place. Invest in top markets throughout the U.S. and build a geographically diverse portfolio… all from the comfort of home.
25+ markets
$600m+ in acquired properties
5000+ investors
15,000+ properties under management
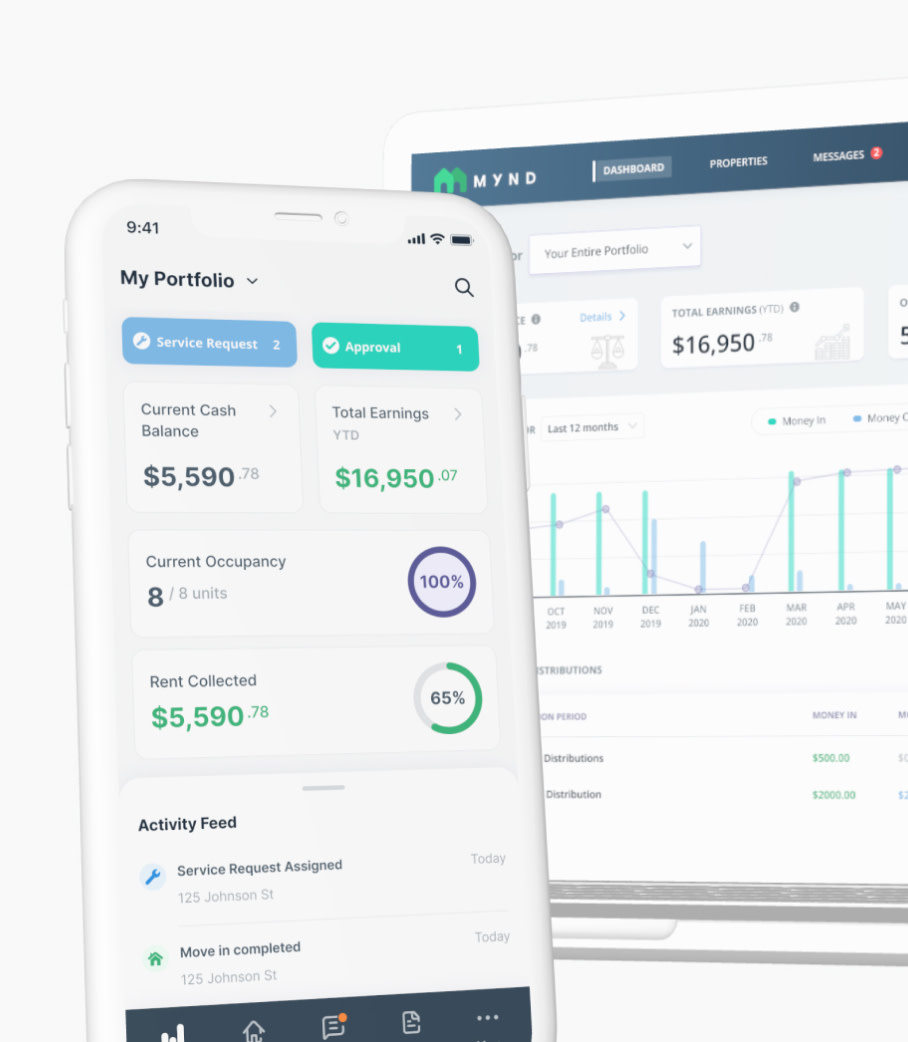
Integrated property management across 25+ markets
Low monthly rates for investors looking for one property manager across their entire real estate portfolio. Pricing based on location.
Select your location
How it works

Sign-up for deals
Provide your contact info to get a list of our current off-market exclusives. These properties are curated for investors and can ONLY be found via Mynd.

Purchase and close
We try to make it as easy as possible for investors: we help you find the right property that matches your long-term investment goals and handle everything else along the way.

Next steps
Once you close, we’ll help with next steps. With our full-service property managers across 25+ markets, we’re ready to help you lease, renovate, and maintain your investment property.
SFR: your new favorite asset class
Why single-family rentals?
Passive incomeLong-term appreciation
Equity leverage
Tax benefits
Unlock single-family rentals as an investment asset class with historically safe, stable, and profitable returns.

“What I really like about Mynd is that I get to be an investor, like a true investor, as opposed to being a landlord.”
Shanif Dhanani
SFR Owner/Investor
![]() Investor location: NYC
Investor location: NYC
 Investment location: Atlanta
From our Resource Center
Ready to speak with our team?